Measurement guide
Accuracy and coordinates
Why do two map area measurements give different results?
Two totals can disagree even when both calculations work correctly. Before blaming the calculator, compare what each outline includes and how its points were placed.
Land Ruler · · 4 min read
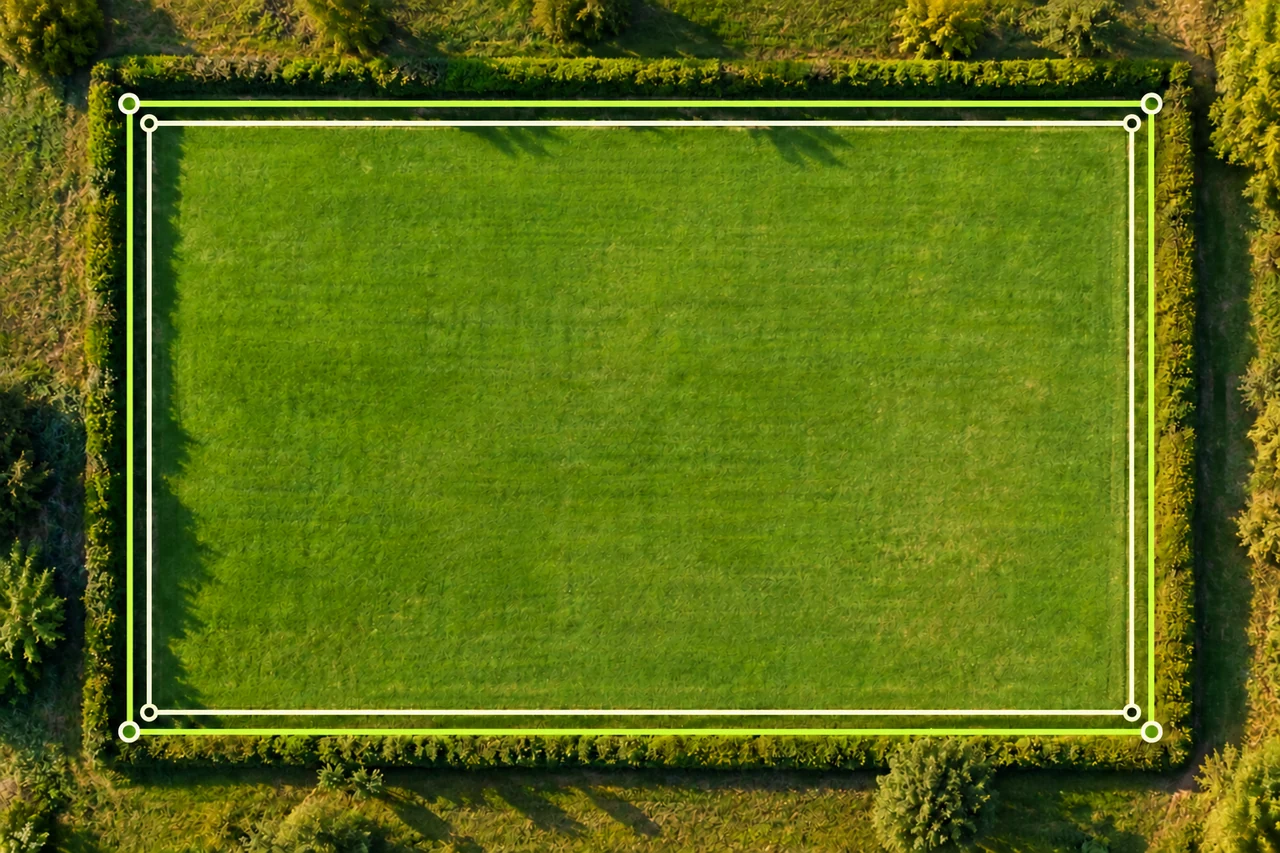
Confirm that both measurements answer the same question
Write a one-sentence boundary definition before comparing numbers. Are you measuring the complete visible field, the cultivated portion, or the space remaining after leaving access? A driveway excluded in one outline and included in another changes the quantity being measured. The two results cannot be reconciled by choosing a different unit.
Also separate a visible working edge from an established parcel boundary. A fence, hedge and crop edge may form three different outlines. If the second estimate came from a document, read its stated basis rather than assuming it follows today’s imagery. Begin troubleshooting with inclusion choices, especially near buildings, gates and shared tracks.
Put units and comparisons on a common basis
Copy each result with its unit and note whether it describes area or perimeter. Square metres, hectares and acres are area units; metres are lengths. A correctly converted result should represent the same quantity, apart from rounding. Keep full intermediate values while comparing, then round the final explanation.
Choose a reference when expressing a percentage difference. In the worked example below, the larger 5,000 m² outline is the reference. The difference is divided by that value. Using the smaller outline as the denominator would answer a different percentage question, so state the denominator instead of presenting an unexplained percentage.
Inspect the calculation diagram
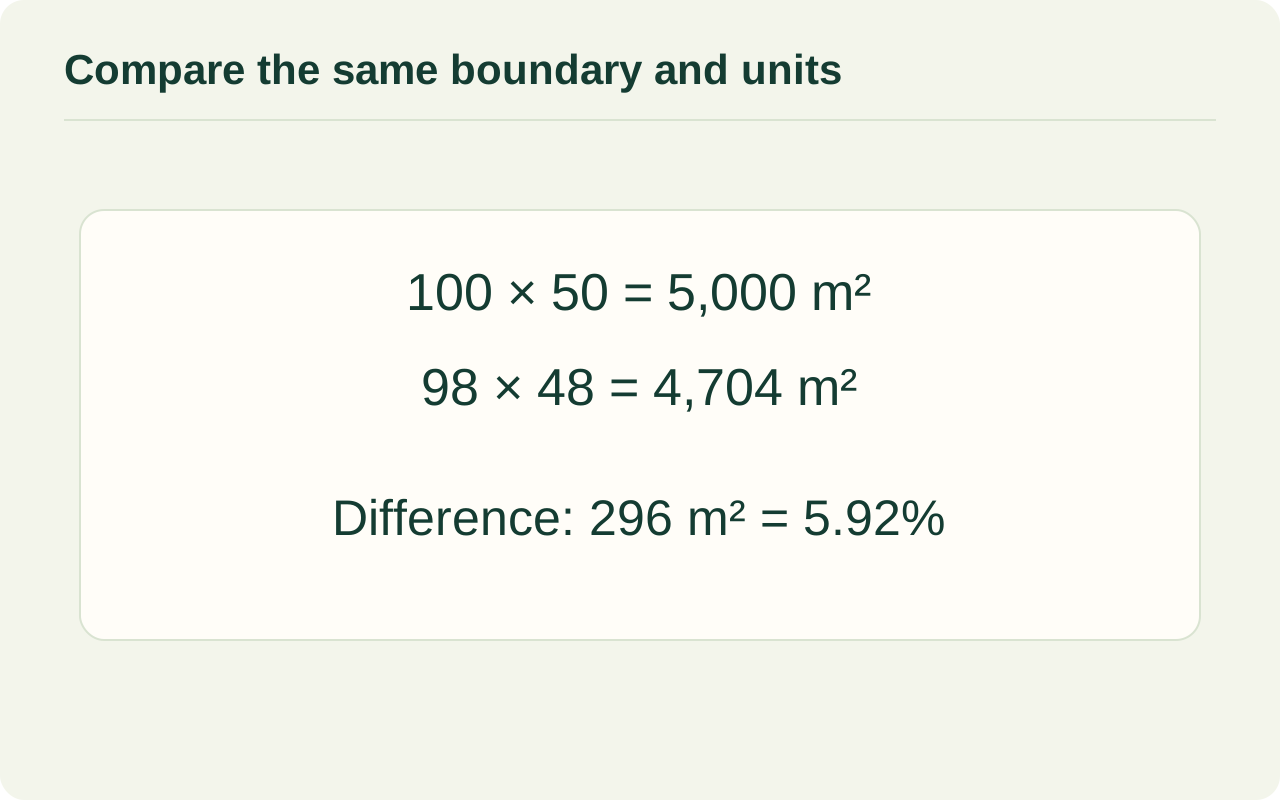
How a small edge change affects a rectangle
Take a purely illustrative rectangle measuring 100 × 50 m: its area is 5,000 m². Move every edge 1 m inward. The new length is 98 m and width is 48 m because each dimension loses 1 m at both ends. The inset area is 98 × 48 = 4,704 m².
The difference is 296 m², and 296 ÷ 5,000 × 100 = 5.92%. This illustrates sensitivity to boundary choice. It is not a GPS error bound and does not predict the error in your field. An irregular boundary, a single displaced corner or a common shift of all corners behaves differently.
| Outline | Dimensions | Area |
|---|---|---|
| Outer | 100 × 50 m | 5,000 m² |
| Inset by 1 m on all sides | 98 × 48 m | 4,704 m² |
| Difference relative to outer | 296 ÷ 5,000 × 100 | 5.92% |
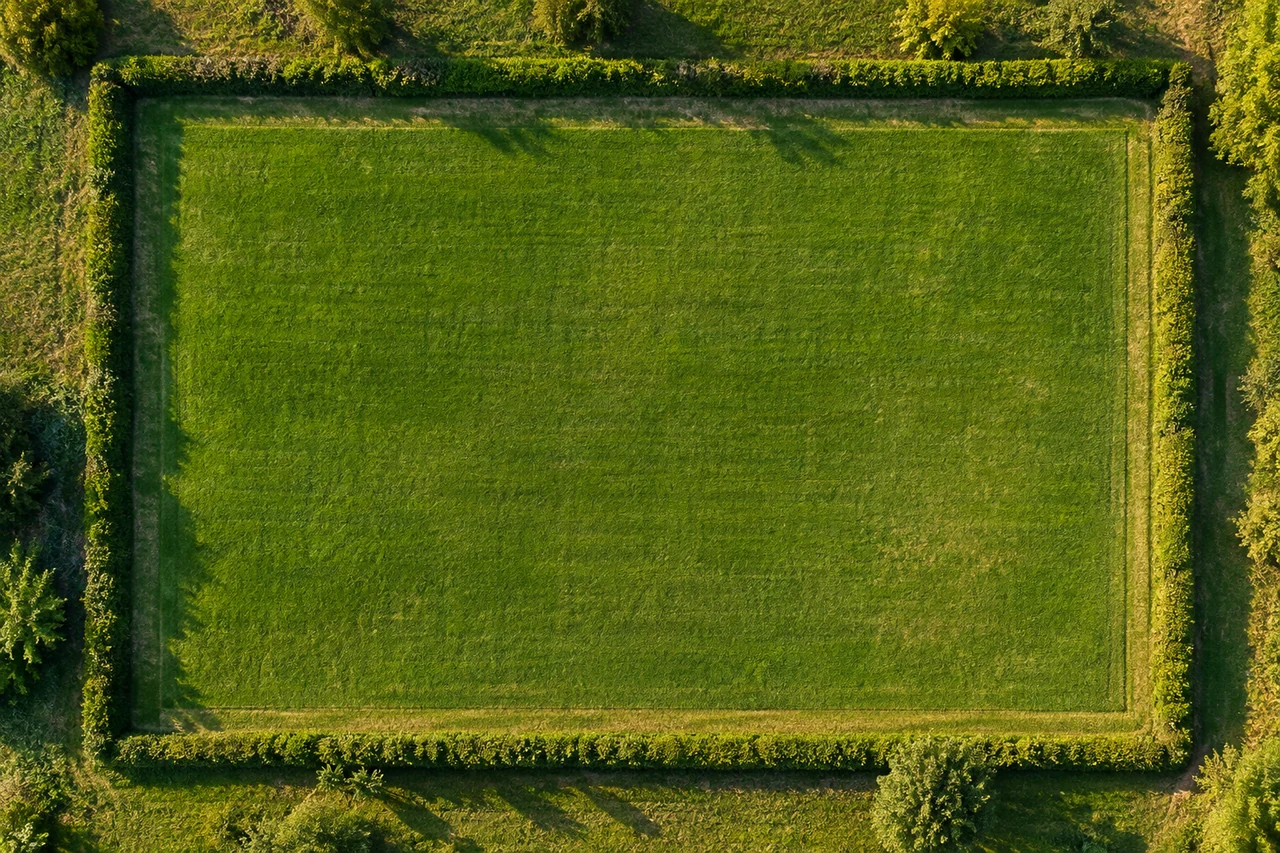
Check what changed behind the drawing
Compare at a similar zoom level and look for the same physical features. Different backgrounds may reveal another capture date, seasonal cover or a different view of a partly hidden edge. If the imagery source changes, do not quietly reinterpret the line and then attribute the entire result change to the calculator.
Sharper imagery does not automatically settle geographic alignment. USGS evaluates image resolution and horizontal accuracy separately in its orthoimagery specification. Treat an apparent mismatch as a question to investigate. Keep a note of the image source or visible context when available, along with which side of a hedge or track you followed.
Redraw independently, then compare the outlines
Start a fresh estimate in the area tool using the agreed boundary definition. Place points where direction actually changes. Extra vertices help describe genuine bends; extra points on an already straight edge do not automatically improve the result. Inspect for a missed corner, an accidental crossing or a detour around a shadow.
Compare the shapes before comparing totals. If both outlines match but totals still disagree, review units and calculation assumptions. If the outlines differ, identify the specific segment responsible. Repetition can expose inconsistency, but close agreement alone does not establish truth. Save the resolved definition so the next person can reproduce the comparison.
Test one disputed edge at a time
If the disagreement is concentrated along a hedge or track, keep the agreed parts of the outline fixed and make two sketches that differ only at that edge. Label the physical feature followed in each. The difference between the totals then shows the consequence of that particular interpretation; it does not give a statistical confidence interval or select the correct boundary. If that difference would change your material order or layout choice, resolve the edge first. Changing several corners and the background together makes it much harder to explain which change caused the new total.
Common questions
Should I average two different area totals?
First explain why they differ. Averaging a full-field outline and a usable-area outline creates a number that represents neither definition.
Do more points always improve accuracy?
No. Points should describe meaningful boundary changes. Unnecessary points can add placement noise or accidental bends.
Does a matching perimeter prove matching area?
No. Different shapes can have the same perimeter and different areas. Compare the actual outlines.
Sources and calculation notes
Figures and numerical scenarios are explanatory examples, not observed field results or application screenshots. Sources support the concepts listed below.
- USGS: Digital Orthoimagery Base Specification
Distinction between imagery resolution and horizontal positional accuracy; the rectangle arithmetic is an original illustration.
- NIST: Bias and Accuracy
Why agreement with a target or reference matters when assessing accuracy.
Continue learning
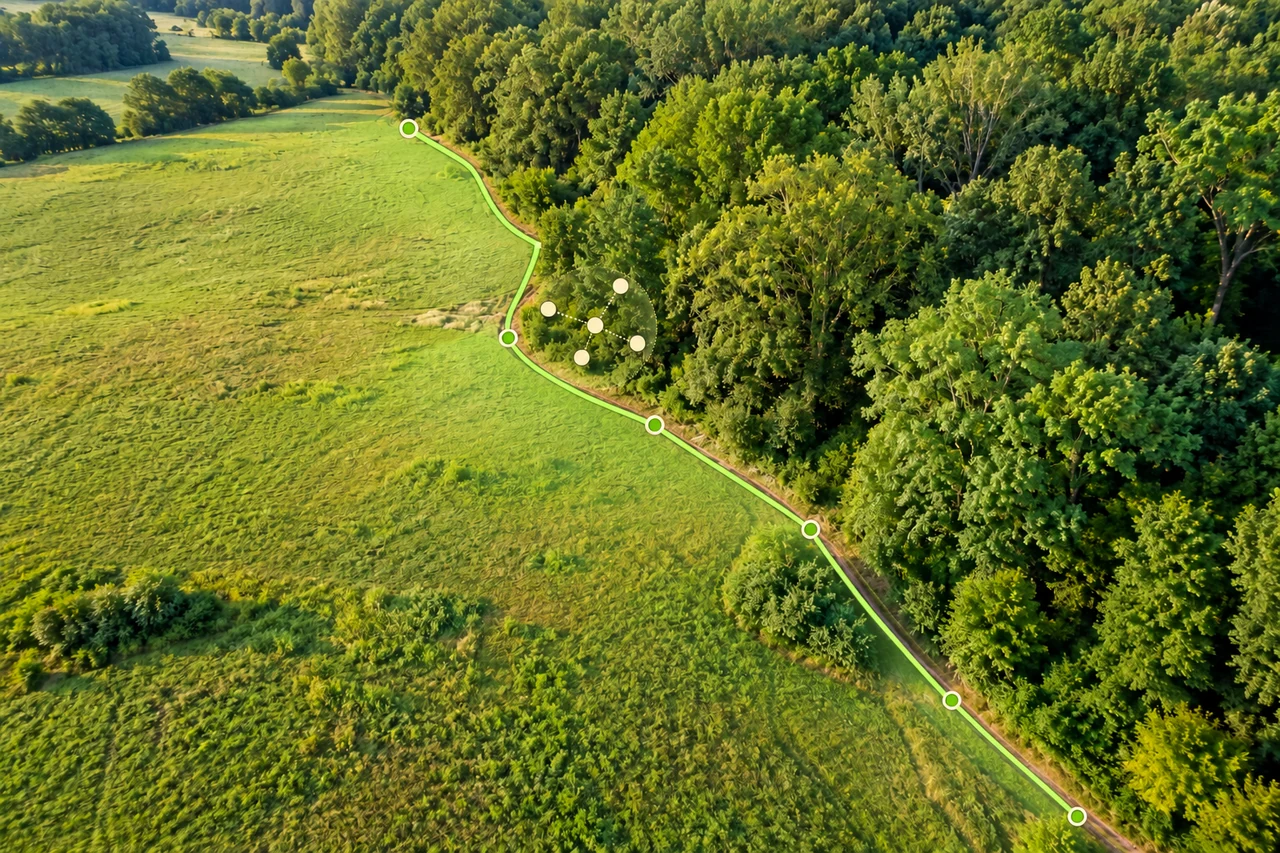
Accuracy and coordinates
How accurate is phone GPS for measuring land area?
Separate phone GPS position, imagery alignment and boundary tracing when estimating land area. Understand uncertainty without misleading accuracy guarantees.
Read the guide →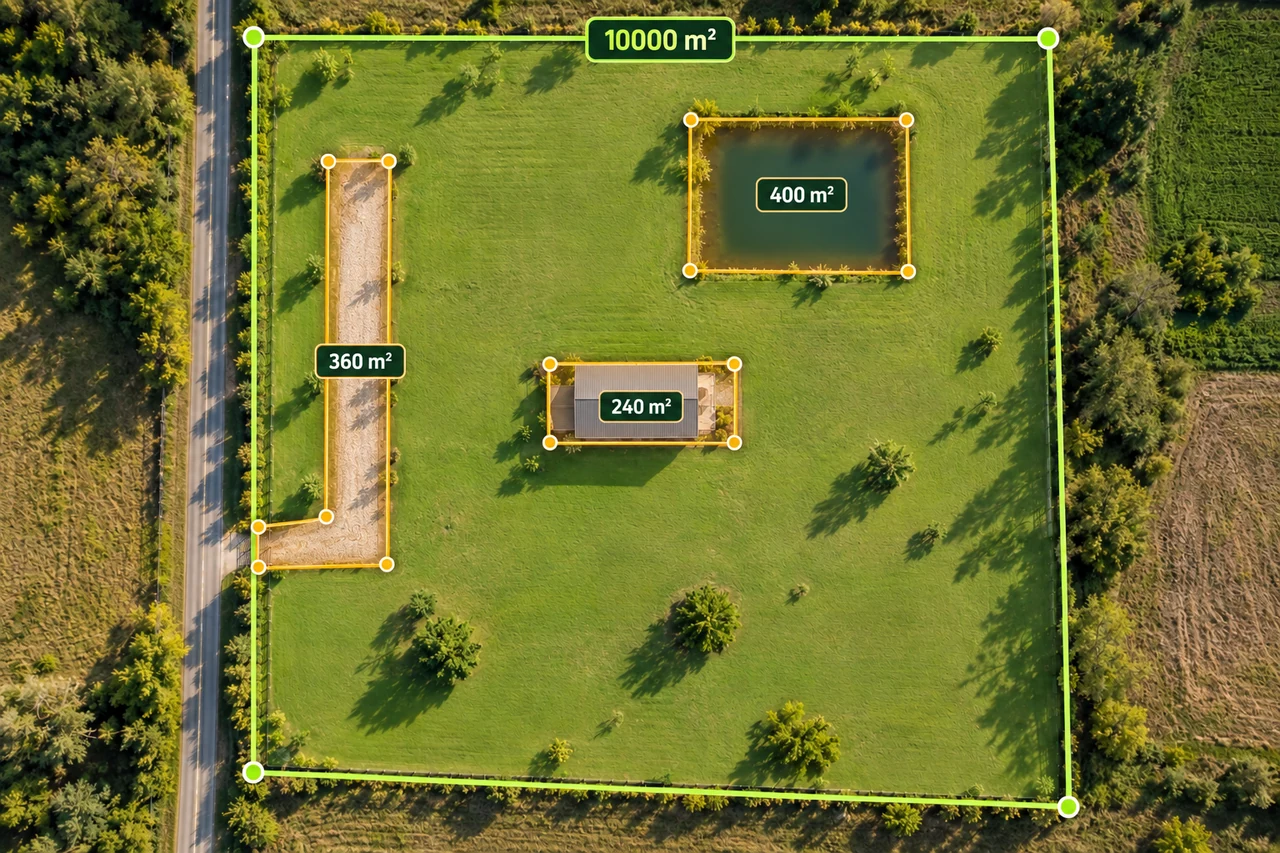
Planning and quantities
Calculate usable land area without subtracting twice
Build a transparent gross-to-net land area worksheet with buildings, access and water exclusions, including overlapping shapes.
Read the guide →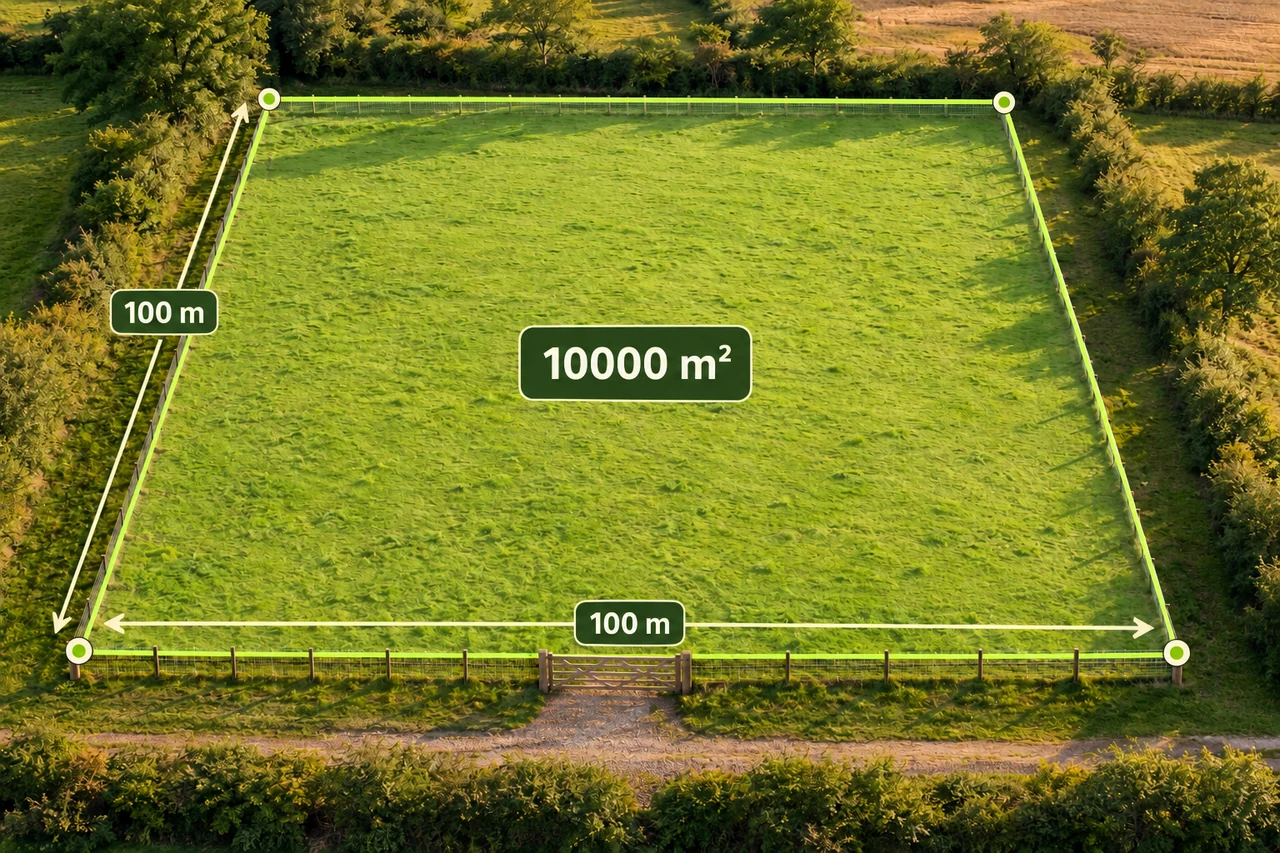
Planning and quantities
How much fence does one hectare need?
Compare three one-hectare shapes, subtract a gate, and turn perimeter into a careful first fencing materials estimate.
Read the guide →